
Conditional statistics on streams
| Guide specification | |
|---|---|
| Guide type: | Wasm code |
| Requirements: | None |
| Recommended reading: | None |
Introduction
To show statistics of signal streams you can use the twinagg() function with a predicate parameter.
create function twinagg(Stream of Timeval s, Number size, Function pred)
                      -> Stream of Timeval of Vector
 /* Stream of time windows over stream `s` represented as
     time stamped vectors where:
     `size` is the window size in seconds
     `pred` is a test function returning true if the window should be emitted */

create function twinagg(Stream of Timeval s, Number size, Function pred, Vector args)
                      -> Stream of Timeval of Vector
 /* Stream of time windows over stream `s` represented as
     time stamped vectors where:
     `size` is the window size in seconds
     `pred` is a test function returning true if the window should be emitted
     `args` is a vector containing any additional arguments to the function pred */
The first version takes a stream of timestamped values, the window size (in seconds) and a predicate function. It produces a window of the values within the latest time window and if the predicate function evalues to true then the window is emitted.
The second version also takes a vector of arguments for the predicate function.
First example
Simulated data stream
First of all we create a function that outputs a stream of timestamped values which mimics some signal:
create function signal_1() -> stream of timeval
  as select stream of tt
       from timeval tt
      where tt in [ts(|2022-03-07T23:10:17.9Z|,1),
                   ts(|2022-03-07T23:10:18.0Z|,2),
                   ts(|2022-03-07T23:10:18.1Z|,3),
                   ts(|2022-03-07T23:10:18.2Z|,4),
                   ts(|2022-03-07T23:10:18.3Z|,5),
                   ts(|2022-03-07T23:10:18.4Z|,6),
                   ts(|2022-03-07T23:10:18.5Z|,7),
                   ts(|2022-03-07T23:10:18.6Z|,8),
                   ts(|2022-03-07T23:10:18.8Z|,9),
                   ts(|2022-03-07T23:10:18.9Z|,10)];
The function above emits a stream of timestamped values 1 through 10 with timestamps ~0.1 seconds apart (with a gap at 18.7). Run the function to see the stream output:
signal_1();
The figure below illustrates how the function signal_1 emits consecutive values from 1 to 10 at specific time intervals:

Predicate function
The simplest predicate function would be a function that always returns true.
create function always_true(object o) -> boolean
  as select 1 = 1;
We can now illustrate how the twinagg works by feeding it with the values from signal_1 and limit the time window to 0.5 seconds. This means that only the values from the last 0.5 seconds will be present in the window. We use the predicate function always_true so all timestamped values in the stream will generate an output.
The figure below illustrates how the twinagg function with the always_true predicate behaves at time 23:10:18.3 when the stream emits the value 5:
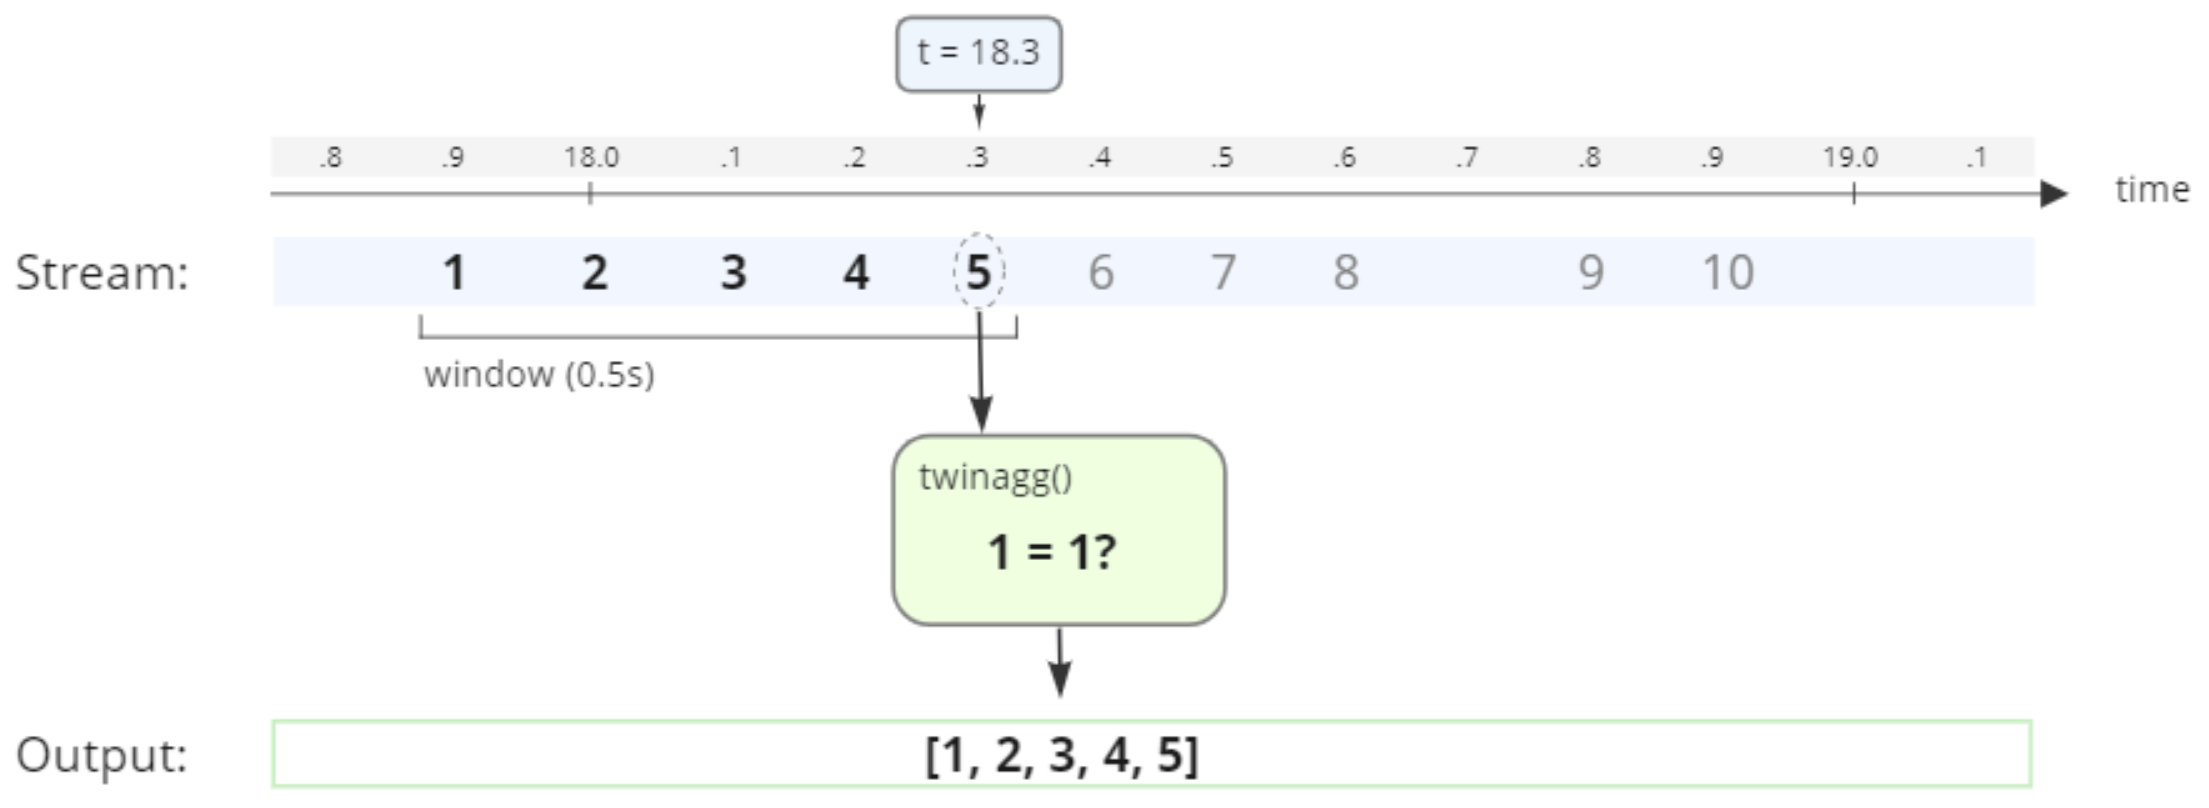
Since 1=1 is true, the values from the last 0.5 seconds (the window size) are emitted as output.
Run the twinagg on the signal with window size 0.5 and predicate function set to always_true and verify that you get the expected result:
twinagg(signal_1(), .5, #'always_true');
You see that the above call to twinagg() emits a result for each timestamp since the predicate function always evaluates to true. Only the values received the last 0.5 seconds are included in each result.
Simple predicate function
To illustrate twinagg() further we can create a new predicate function that only returns true if the value exceeds some threshold.
create function threshold(Timeval of Number tn) -> boolean
  as select value(tn) > 6;
The above predicate function takes a timestamped value and evaluates to true if the value is greater than six.
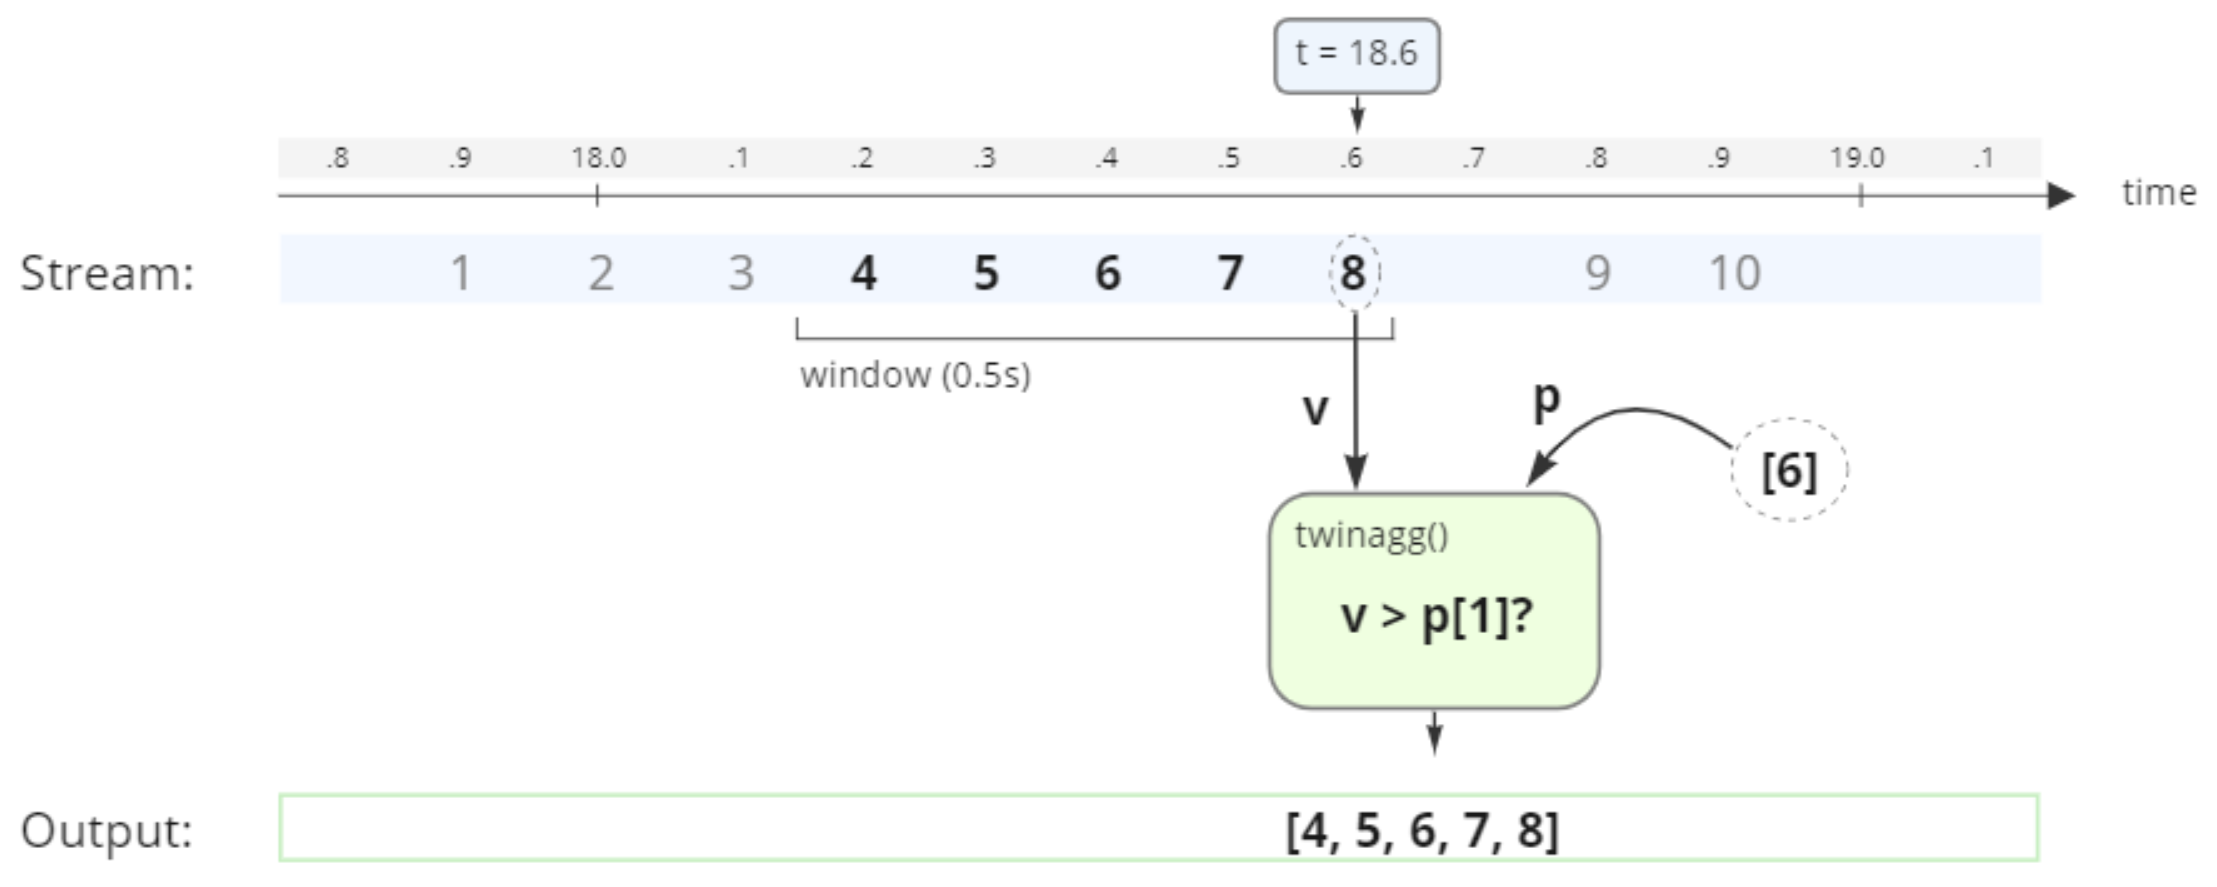
We can use our new predicate function in a twinagg() on signal_1() with a time window of 0.5 seconds. The figure below illustrates how the twinagg behaves at time 23:10:18.3 when the stream emits the value 5:
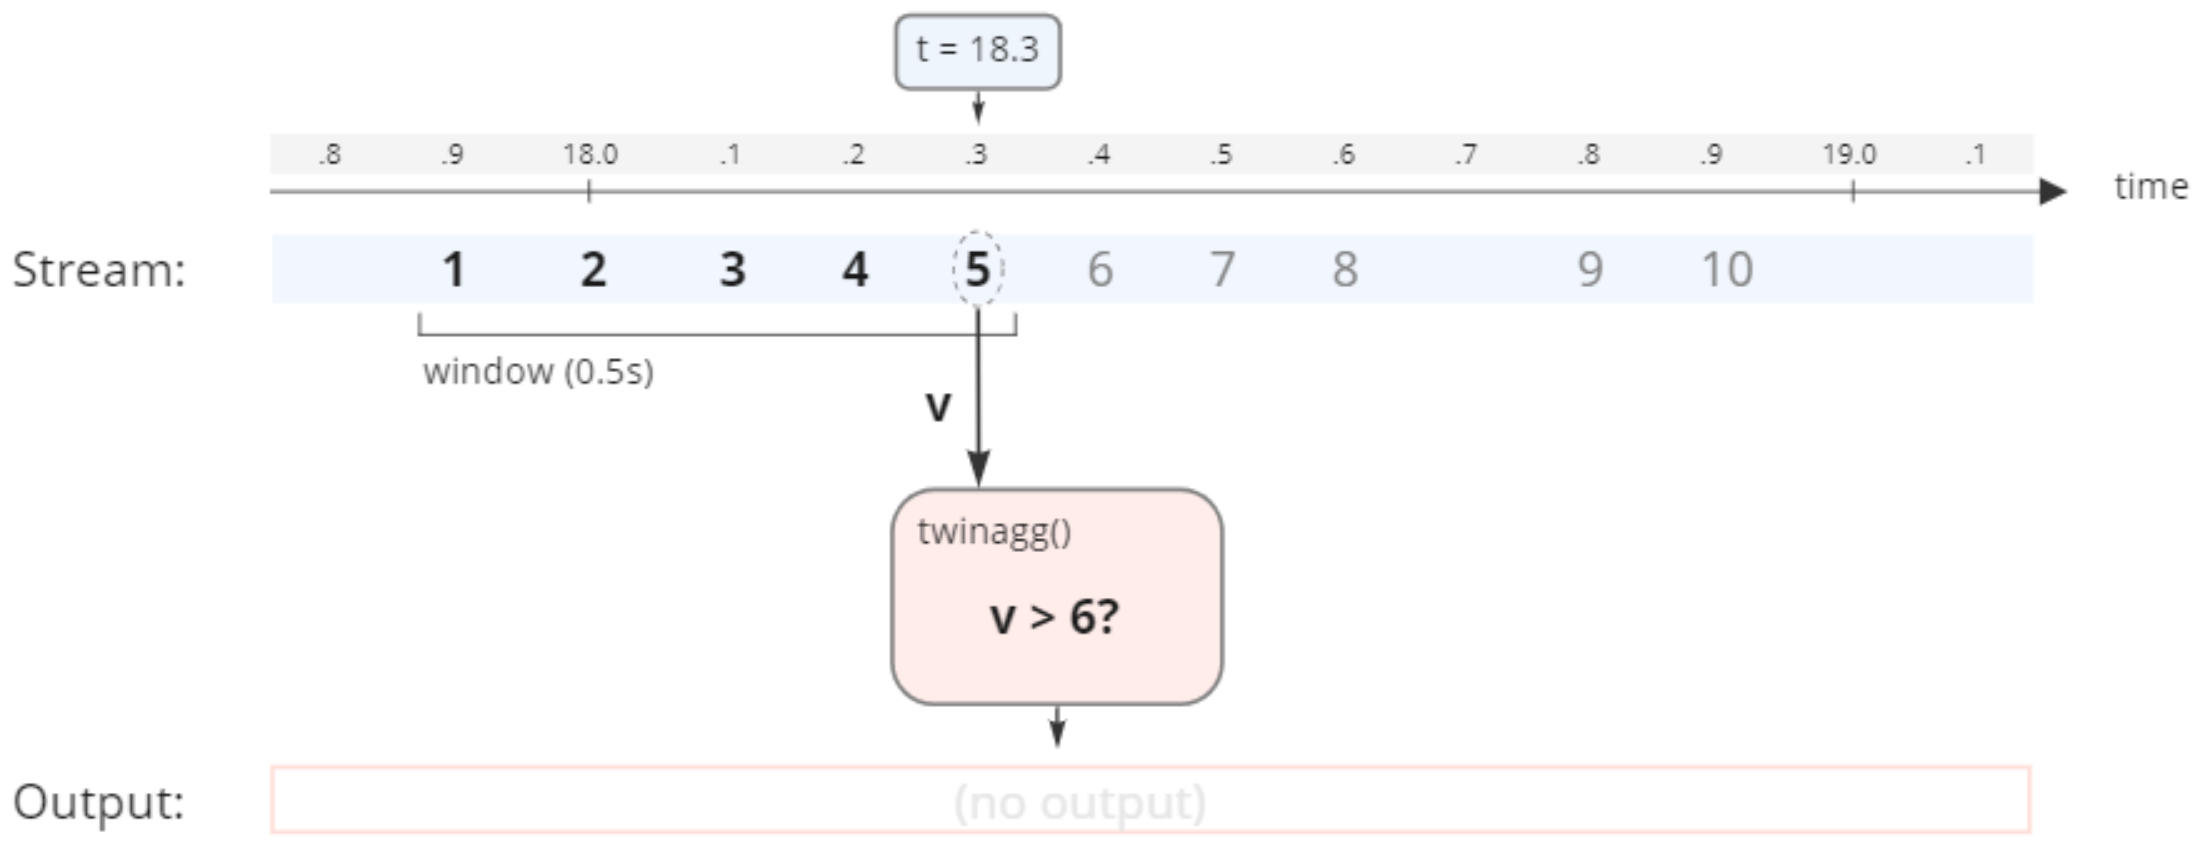
Since the value v is less than 6, the twinagg does not emit any output. However, if we look at the result at the time 23:10:18.6 when the stream emits the value 8:
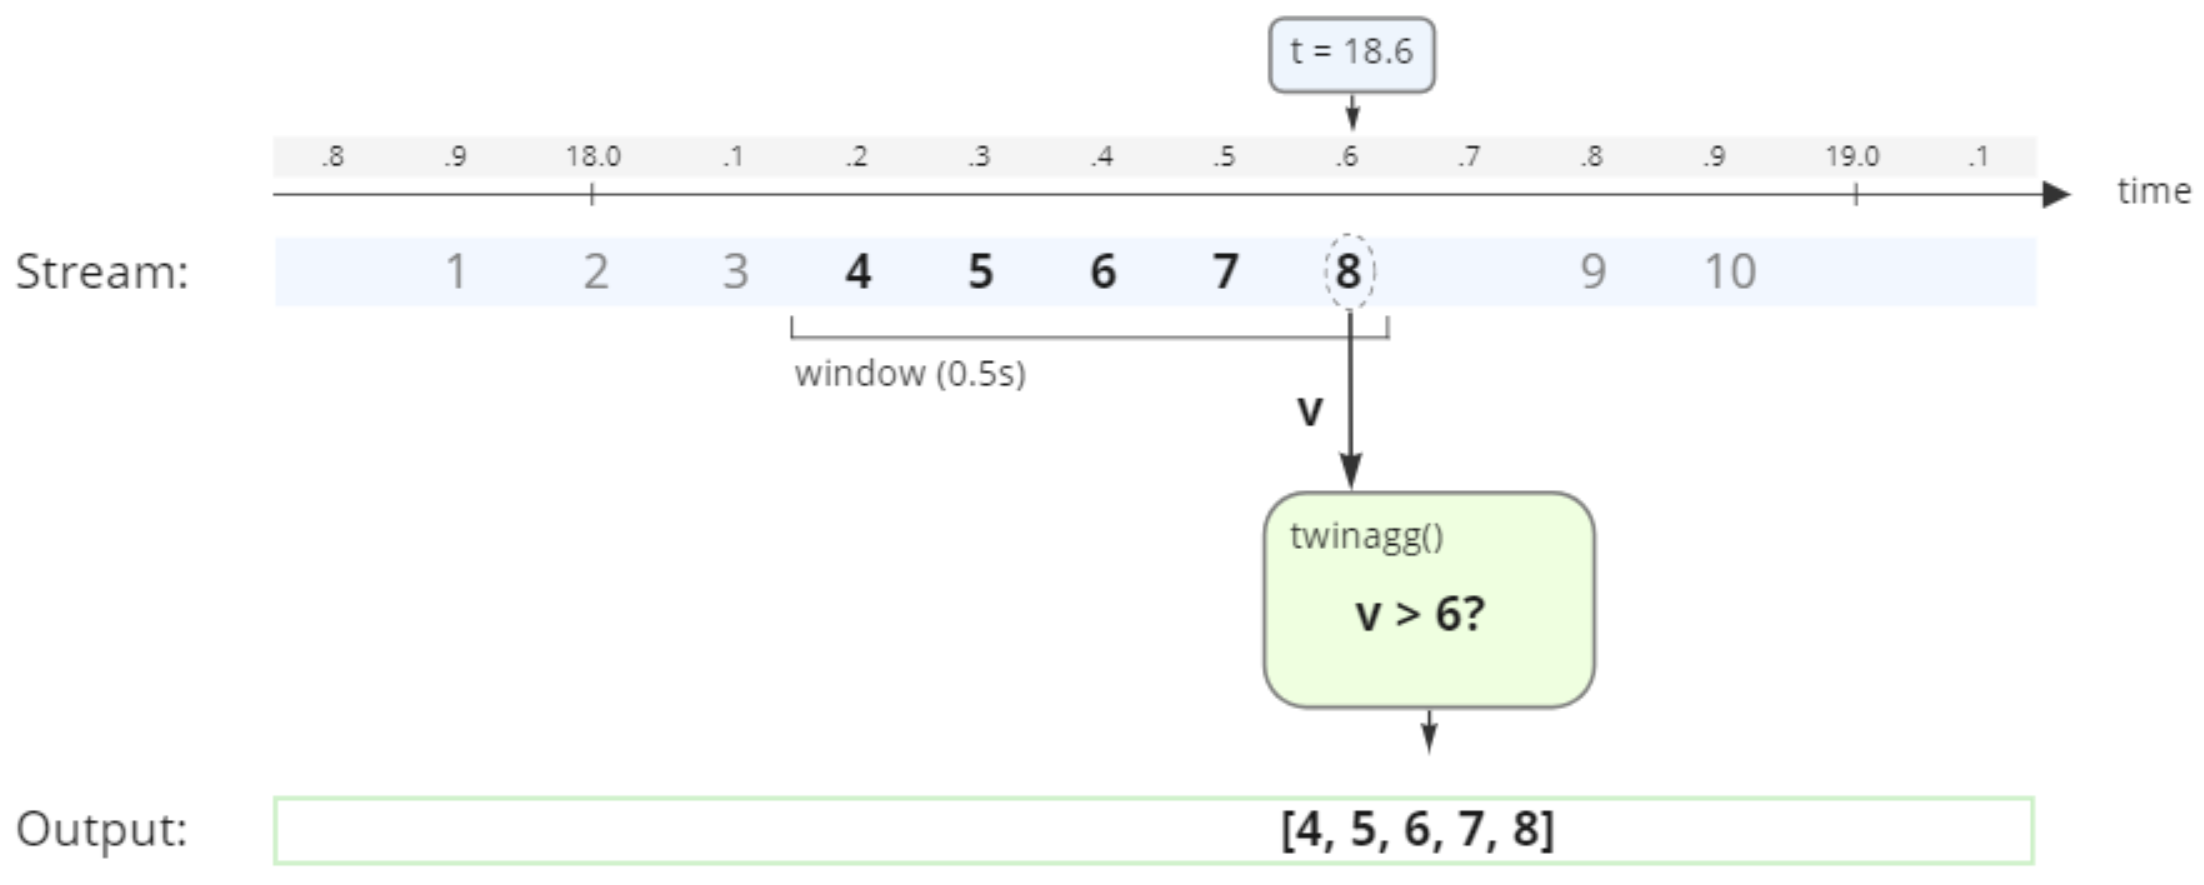
The value for v is now larger than 6, and therefore the values from the last 0.5 seconds are emitted as output.
Run the twinagg on the signal with window size 0.5 and predicate function set to threshold and verify that you get the expected result:
twinagg(signal_1(), .5, #'threshold');
You see that once the value from signal_1() goes above 6 twinagg() starts to emit the time window.
Extracting values from timeval
The timeval objects emitted contain both the time stamps and the values, but if we are only interested in the values without the time stamps we can easily wrap the call to twinagg() in a select statement that extracts the values.
select value(tsv)
  from timeval of vector tsv
 where tsv in twinagg(signal_1(), .5, #'threshold');
Predicate function with parameters
If we want a threshold predicate that works with different threshold values we can create a predicate that takes a vector parameter.
create function threshold_param(Timeval of Number tn, Vector params)
  -> boolean
  as select value(tn) > params[1];
The above predicate function takes a time stamped value and evaluates to true if the value is greater than the first value in the parameter vector.
We can use our new predicate function in a twinagg on signal_1 with a time window of 0.5 seconds. The figure below illustrates how the twinagg behaves at time 23:10:18.3 when the stream emits the value 5:
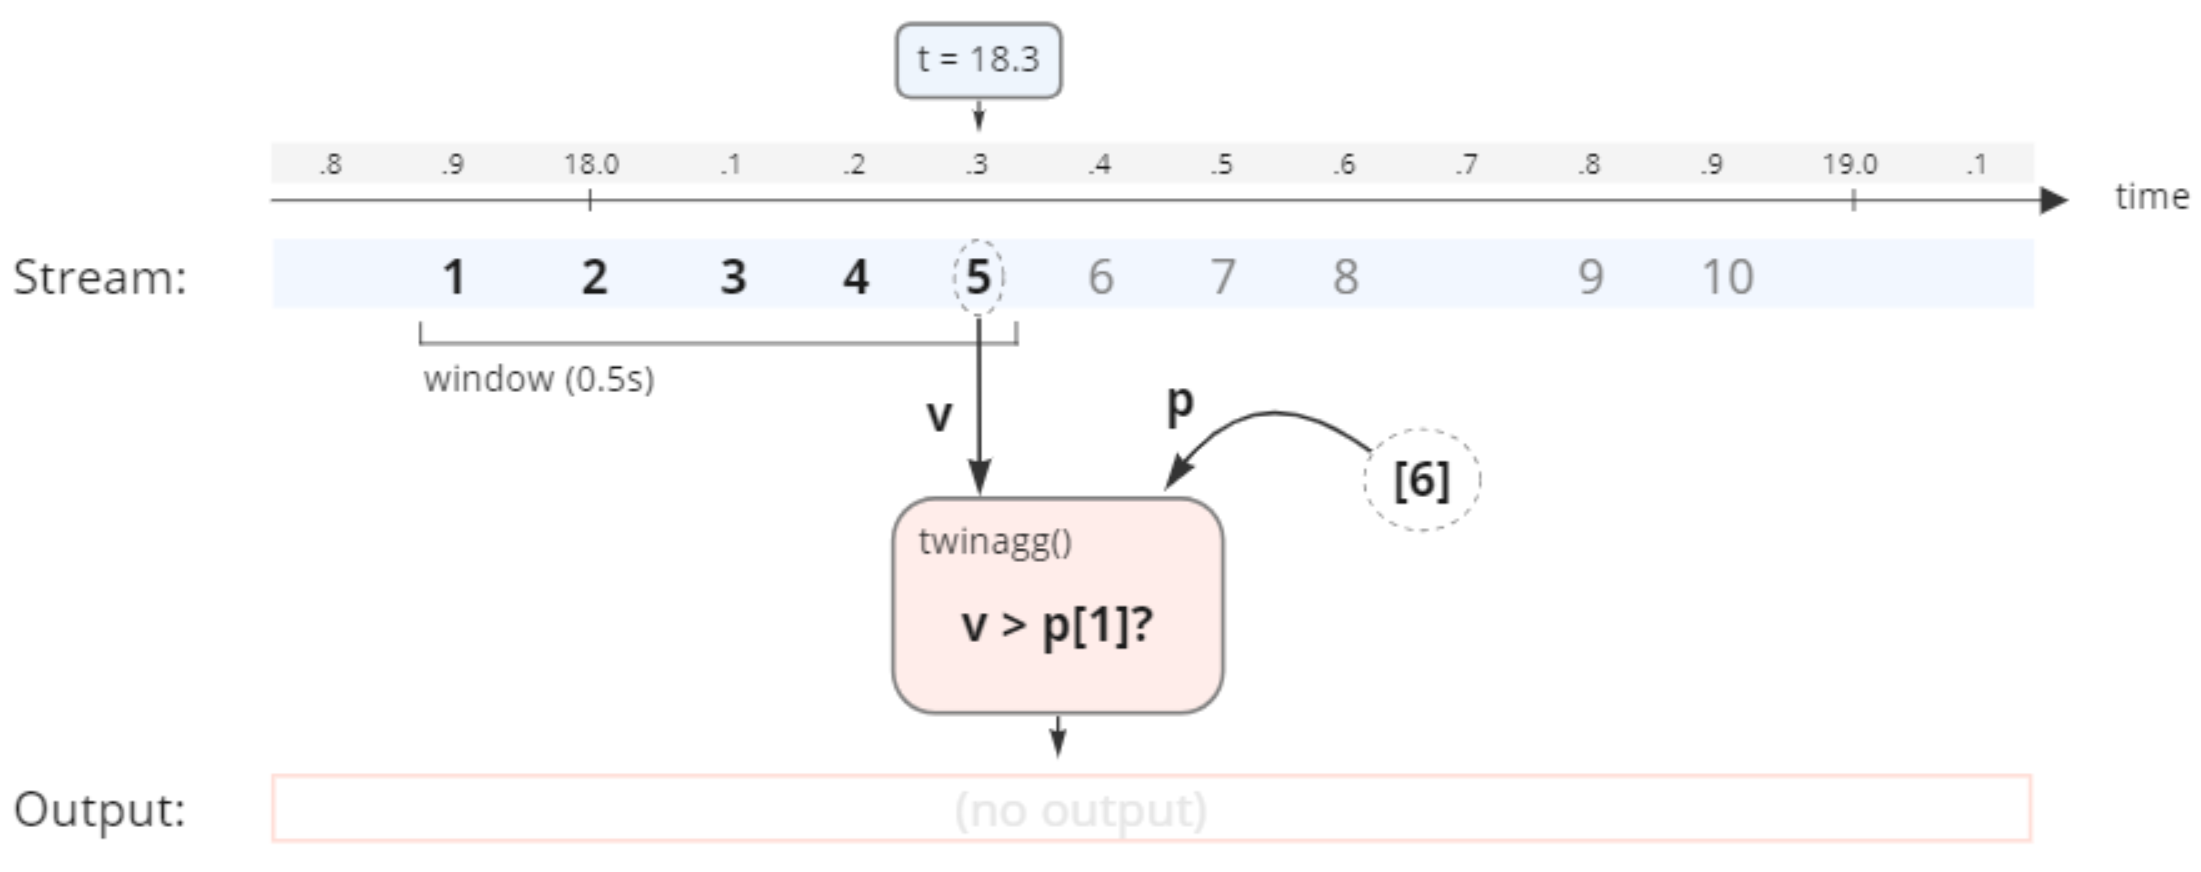
Since the value v is less than the first element in the p vector (6), the twinagg does not emit any output. However, if we look at the result at the time 23:10:18.6 when the stream emits the value 8:
The value for v is now larger than the first element in the p vector (6), and therefore the values from the last 0.5 seconds are emitted as output.
Run the twinagg on the signal with window size 0.5 and predicate function set to threshold_param and verify that you get the expected result:
twinagg(signal_1(), .5, #'threshold_param', [6]);
You see that once the value from signal_1() goes above the first element in the p vector (6) twinagg() starts to emit the time window.
Multi-valued streams
Until now we have only worked with single-valued streams. Typically you have some method that emits a vector of signals from multiple sources.
Simulated data stream
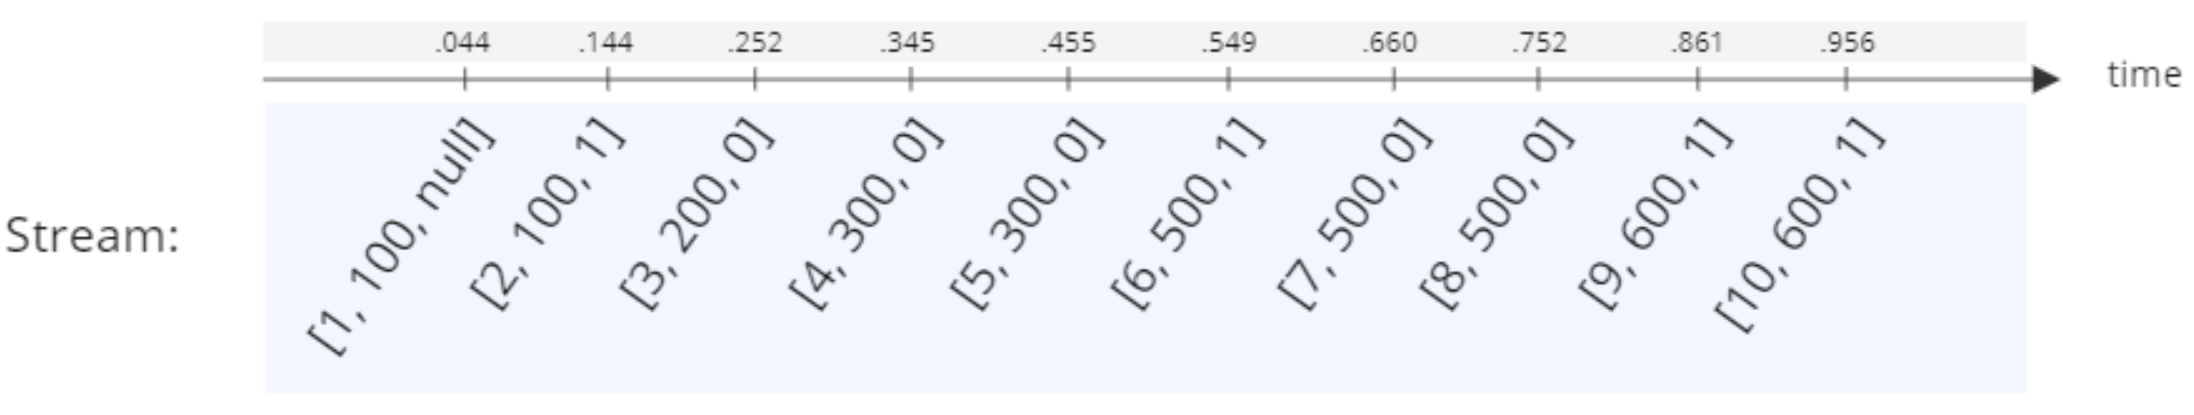
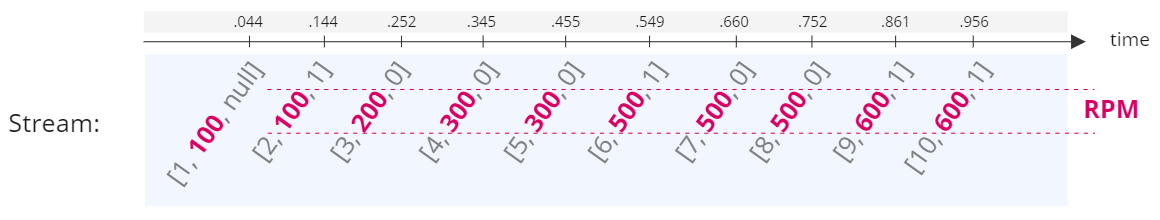
Here we have a function that emits a stream containing three signals. The first signal emits the values 1 through 10, the second signal has values between 100 and 600, and the third signal is a simple 0/1 signal with possible null values.
create function multisignal() -> stream of timeval
  as select stream of tt
       from timeval tt
      where tt in [ts(|2022-03-08T08:06:39.044Z|,[1, 100, null]),
                   ts(|2022-03-08T08:06:39.144Z|,[2, 100, 1]),
                   ts(|2022-03-08T08:06:39.252Z|,[3, 200, 0]),
                   ts(|2022-03-08T08:06:39.345Z|,[4, 300, 0]),
                   ts(|2022-03-08T08:06:39.455Z|,[5, 300, 0]),
                   ts(|2022-03-08T08:06:39.549Z|,[6, 500, 1]),
                   ts(|2022-03-08T08:06:39.660Z|,[7, 500, 0]),
                   ts(|2022-03-08T08:06:39.752Z|,[8, 500, 0]),
                   ts(|2022-03-08T08:06:39.861Z|,[9, 600, 1]),
                   ts(|2022-03-08T08:06:39.956Z|,[10, 600, 1])];
Run the function to see the stream output:
multisignal();
The figure below illustrates how the function multisignal emits the vector values at specific time intervals:
Predicate function
Let's create a predicate function that thresholds the multisignal stream on the first signal. This will be convenient when we illustrate the ouptput of twinagg() for multi-valued streams. Since multisignal() emits a timestamped vector, the predicate function passed to twinagg() needs to take a Timeval of Vector.
create function threshold_multi(timeval of vector tv, Vector params)
  -> boolean
  as select v[1] > params[1]
       from vector v
      where v = value(tv);
We can now use a predicate parameter vector [6] to make the twinagg output a time window each time the first signal v[1] is larger than 6. We still use a time frame of 0.5 seconds for our window. The figure below illustrates how the twinagg behaves at time 08:06:39.549 when the stream emits the vector [6, 500, 1]:
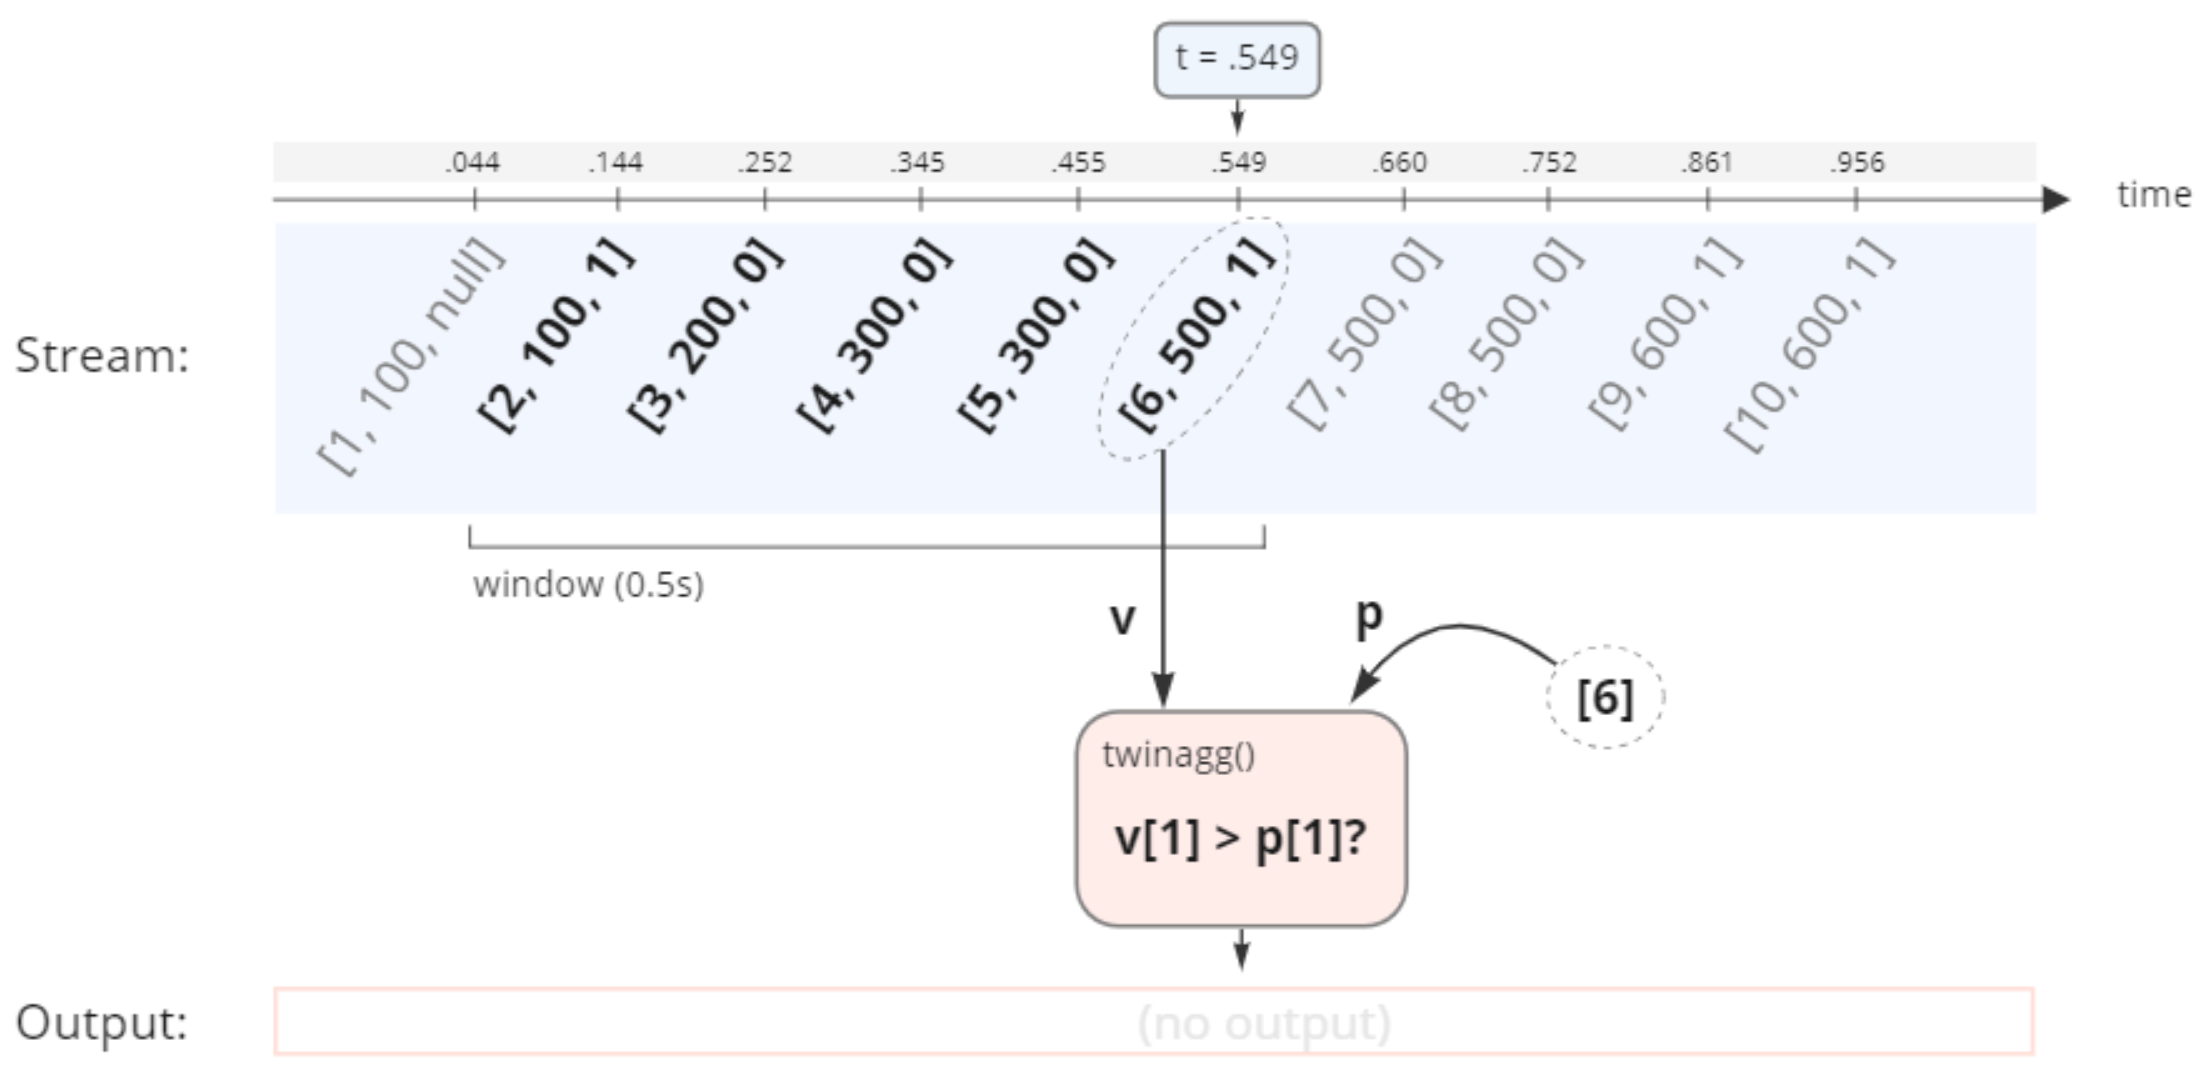
The first element in the vector v (6) is not larger than the first element in the vector p (also 6). Therefore twinagg does not emit any output. However, if we look at the result at the time 08:06:39.660 when the stream emits the vector [7, 500, 0]:
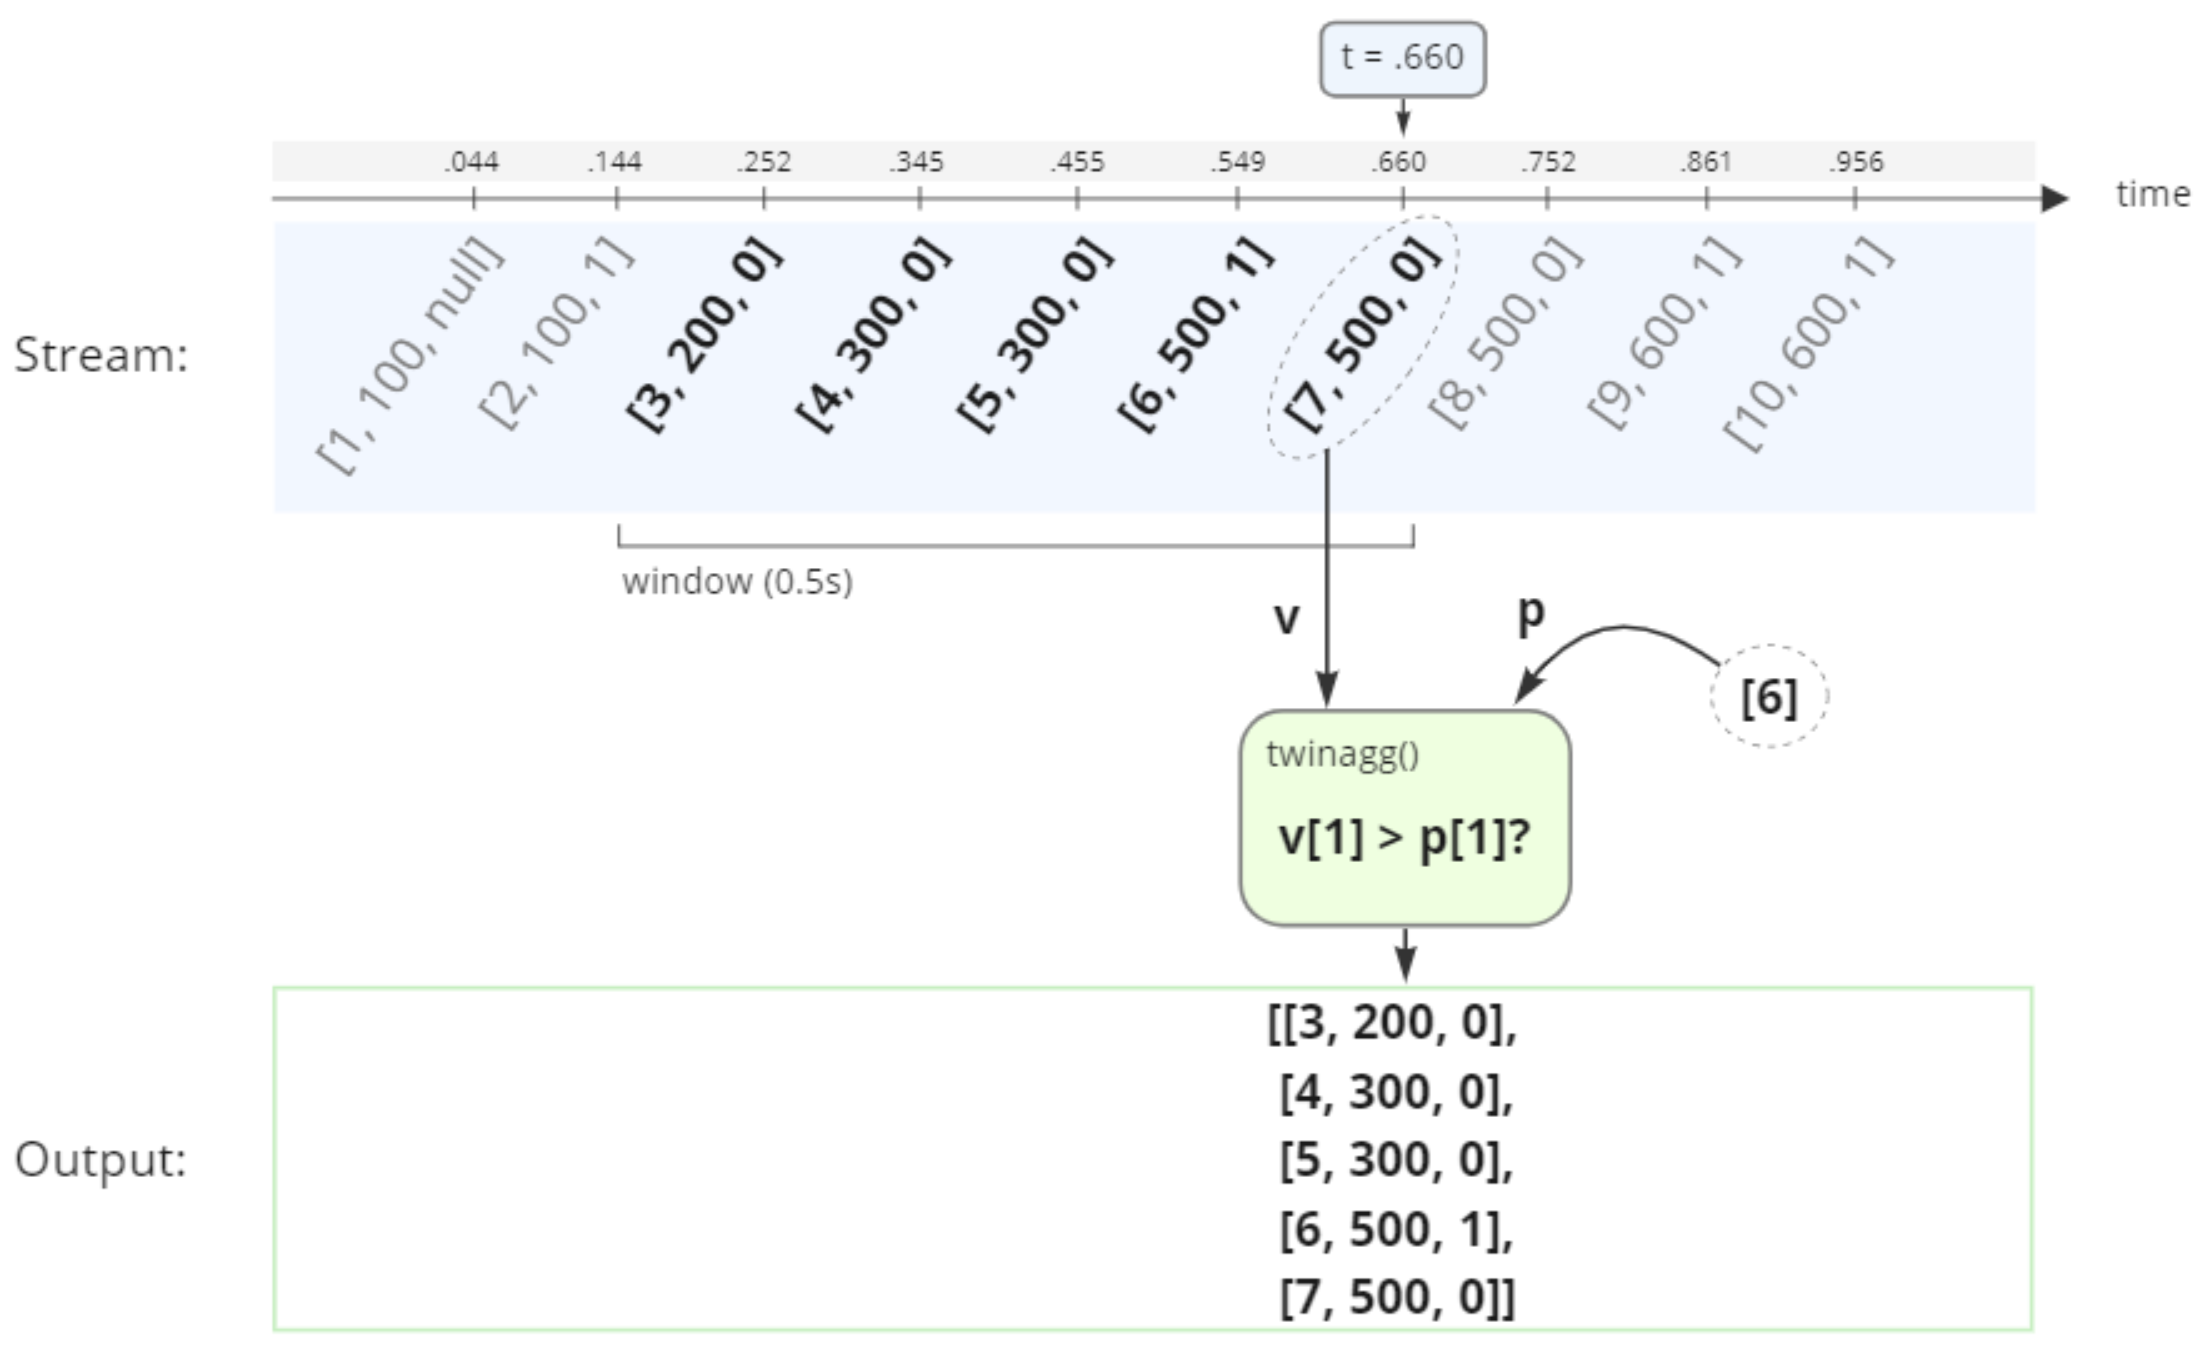
The first element in the vector v (7) is now larger than the first element in the vector p (6). Therefore the vectors from the last 0.5 seconds are emitted as output.
Run the twinagg on the signal with window size 0.5 and predicate function set to threshold_multi and verify that you get the expected result:
twinagg(multisignal(), .5, #'threshold_multi', [6]);
We see that each time the first element in the vector stream is greater than 6, twinagg() emits a vector with the vectors from the last 0.5 seconds.
Statistics on multi-valued streams
Transpose result to separate signal windows
Each inner vector in the result is a triplet of values from three different signals. To be able to do statistics on a single signal we need to transform the result so that all values from a single signal ends up in a single vector. We can do this by transposing the result.
Let's say that we have three sensors , , and and their output is collected as a stream of vectors (which is exactly what multisignal() does). If we apply winagg() with size on this stream we get a Vector of Vector of Number which is a Matrix
If we transpose this we get all values for each sensor in a separate vector.
This means we can now do statistics over signal , or by operating on their respective vectors , and .
Let's say that the second signal in the multisignal stream represents RPM values from an engine:
To be able to do statistics on the RPM from the twinagg result we need to transpose the result so all RPM values are output in a single vector.
For example, consider transposing the result from twinagg in our previous example. The figure below illustrates how the transposed result has one vector per signal, and the RPM values are colored in burgundy:
So to get the readings from each signal into a seperate vector per signal we can create a select statement around twinagg that transposes the result. Run the following query and see that you get the expected results:
select ts, vt
  from timeval of vector tsv, timeval ts, matrix v, matrix vt
 where tsv in twinagg(multisignal(), .5, #'threshold_multi', [6])
   and v = value(tsv)
   and vt = transpose(v)
   and ts = timestamp(tsv);
We see that the query emits a result each time the first signal is greater than 6 and that the values from each signal is stored in a separate vector in the result. So we now have one vector per signal which is exactly what we need to do statistics over each of the signals.
Trigger statistics on signal
Let's say that the second signal in multisignal is RPM values from an engine and the third signal is a light indicator which signals that something has gone wrong. Whenever the indicator light switches on we would like to see some statistics for the engine RPM.
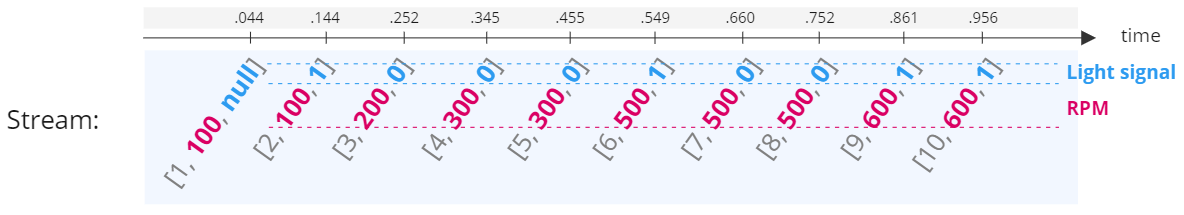
To accomplish this we first need to define a new predicate function that evaluates to true whenever the indicator light is on (i.e., when the third signal is equal to 1):
create function on_light(timeval of vector tv) -> boolean
  /* Returns true when element 3 in the vector is equal to 1,
     false otherwise. */
  as select v[3] = 1
       from vector v
      where v = value(tv);
Now we can use this new predicate function in a call to twinagg() and wrap it in a function that both transforms the result (as shown in the select statement from the previous section) and carries out any statistics calculations we might be interested in.
create function statistics_on_light() -> stream of vector
  as select [ts, rpm_window, mean(rpm_window), stdev(rpm_window)]
       from timeval of vector tsv, timeval ts, matrix v,
            matrix vt, vector of number rpm_window
      where tsv in twinagg(multisignal(), .5, #'on_light')
        and v = value(tsv)
        and vt = transpose(v)
        and ts = timestamp(tsv)
        and rpm_window = vt[2];
The function above will show the timestamp, the RPM values for the last 0.5 seconds, and the mean and standard deviation of the RPM each time the indicator light is on. Try it by executing the following query:
statistics_on_light();
Specify which signal should trigger output
The on_light predicate function assumes that the light has index three in the vector. This might be subject to change, or you might have other signals that you wish to use as alerts. It would therefore be better if we could provide the index for the alert signal as input. To illustrate this we can define a new predicate function for general alerts:
create function on_alert(timeval of vector tv, vector params)
  -> boolean
  as select v[signal_index] = 1
       from vector v, number signal_index
      where v = value(tv)
        and signal_index = params[1];
We can now tweak the statistics_on_light function by passing the index of the light signal into the predicate function:
create function statistics_on_alert(Number signal_index)
  -> stream of vector
  as select [ts, rpm_window, mean(rpm_window), stdev(rpm_window)]
       from timeval of vector tsv, timeval ts, matrix v,
            matrix vt, vector of number rpm_window
      where tsv in twinagg(multisignal(), .5, #'on_alert', [signal_index])
        and v = value(tsv)
        and vt = transpose(v)
        and ts = timestamp(tsv)
        and rpm_window = vt[2];
Try the new function by calling it with the index set to three:
statistics_on_alert(3);
You should get the same result as you did for statistics_on_light but now you have specified the index of the alert signal manually.
And that concludes this guide on how to use twinagg for conditional time-windowed statistics on multi-signal streams.