Debugging
Introduction
When developing software, the programs we write seldom work on the first try. There is always need for debugging your application. Different languages and tools provide their own ways of aiding the developer in the debugging process. Here we will go through various debugging techniques and other useful information for developing in SA Engine.
Declarative vs procedural languages
OSQL is a declarative language. How you work with declarative languages is fundamentally different from how you work with procedural languages (like C, Java, or Python). In procedural languages code is executed line-by-line, and when something goes wrong the debugger can tell you exactly on what line the error happened and what the state of the program was at the time of execution. In declarative languages this does not exist. Code provided by the user is restructured and transformed in order to come up with the best possible execution plan. Whenever something goes wrong in the execution plan there is literally no way for the parser to know on which line the error happened because it does not have any idea there are lines, there are only declarations.
So how does one approach debugging in declarative languages? The best approach is simply to use iterative development, testing each step along the way, and make sure to split up complex declarations into smaller manageable parts. In OSQL this means splitting up big queries into small functions that can be tested individually. Another useful recommendation is to not shy away from the command line interface (CLI) tools. Text editing is a chore with them, and they don't display complex data very well, but they get you closer to the query and the database and often that makes things much easier even with the drawbacks of CLI.
One special feature of OSQL is its functionality for processing streams. This can be very useful for debugging purposes. In OSQL one can set up data flows (named streams) to send data. Data flows are a naturally used for controlling data flow through analytics pipelines but can also be used for outputting or plotting debug information, or sending debug information to an external listener. How to use data flows for debugging is covered more in depth in other parts of this document.
SA Engine Output
Before we dive into the specific debugging techniques it is good to know how the SA Engine output works. There are two types of output from SA Engine, results and return values (error codes). Results are for example the results of evaluated functions and queries -- the query output -- while return values are the execution results (OK if a query is successful and otherwise an error).
If we run SA Engine in a console using the SA Engine CLI, all results are written to the console but the return values are not written to the console explicitly. If a query is successful the console will print the query result, but if a query is unsuccessful it will print an error message.
[sa.engine] >cos(pi());
-1.0                                                             // <-- successful result

[sa.engine] >cos(pi();
2025-03-06T10:36:39.626 ERROR - syntax error in line 2           // <-- error message
cos(pi();
        ^
If we run SA Engine in VSCode and use an interactive window, either by writing the query directly into the interactive prompt or by stepping through a file, then the query result or any potential error message will be displayed below the query in the interactive window.
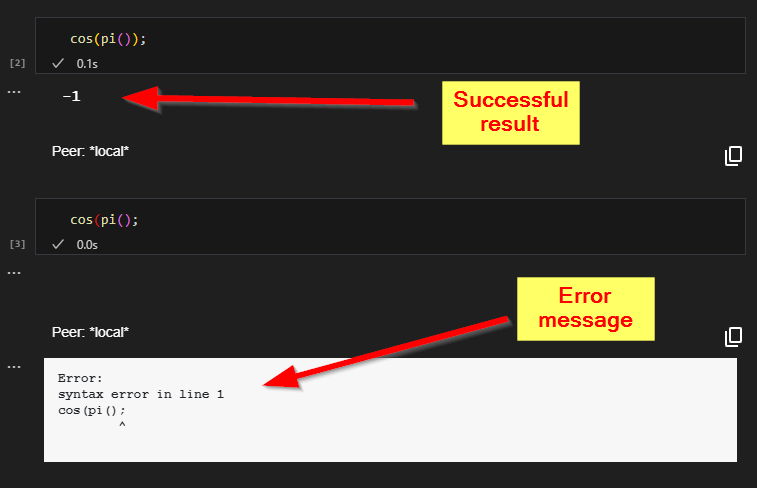
Query with successful result and query with error message.
Debugging OSQL
Print statement debugging
A common way to do debugging in many programming languages is to add “print“ statements that output information to the console. OSQL has the print() function that can be used for this purpose. print() takes any object as input and writes the object as text to the console. The return type of print is boolean so a print() query also returns TRUE as query result unless there is an error.
print()It is important to know that using print() decreases performance. print() is a stateful function and therefore changes the execution plan. The query optimizer won't be able to fully “work its magic“ for queries that include print() and that can potentially have large negative effects on performance. It is important to be aware of this and it's highly recommended to only use print() in development environments. All calls to print() should be removed before deploying to production.
[sa.engine] >print("Hello!");

Hello!                                         // <-- print() output
TRUE                                           // <-- query result
[sa.engine] >print(1 + 2 + 3);

6                                              // <-- print() output
TRUE                                           // <-- query result
[sa.engine] >print(pi());

3.141592653589793                              // <-- print() output
TRUE                                           // <-- query result
[sa.engine] >print(functionnamed("pi"));

#[OID 684 "PI"]                                // <-- print() output
TRUE                                           // <-- query result
The print() function can be used in select queries just like any other statement.
[sa.engine] >select i from integer i where i in range(3) and print("i="+i);

i=1                                // <-- print() output
1                                  // <-- query result
i=2                                // <-- print() output
2                                  // <-- query result
i=3                                // <-- print() output
3                                  // <-- query result
And in functions.
[sa.engine] >create function my_func(integer i) -> integer
as select j
     from integer j
    where j = i*2
      and print("Hello i="+i+",j="+j);

[sa.engine] >my_func(3);

Hello i=3,j=6                                // <-- print() output
6                                            // <-- query result
Print statement debugging in VSCode
The VSCode interactive window works a bit differently than the SA Engine CLI console. The interactive window only displays query results and does not show output printed to the console.

VSCode interactive window shows only query result and no output printed to console.
There are a few different ways of getting output from print() when working in VSCode.
- Use the console logger - this is the recommended way.
- Work on an edge instance.
- Subscribe to the output of a peer.
We'll cover each one here separately.
1. Use the console logger
As of version v1.6.2, SA VSCode has the console logger activated by default. This means that all print() output appears in the VSCode Output window. It can be accessed by selecting "Output" in the "View" menu.
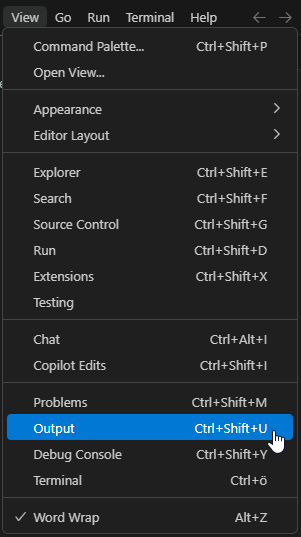
Output in the View menu.
The Output window has a drop-down list where you can select which process you want to see the output from. In this list you can select the SA Engine instance run by the SA VSCode plugin.
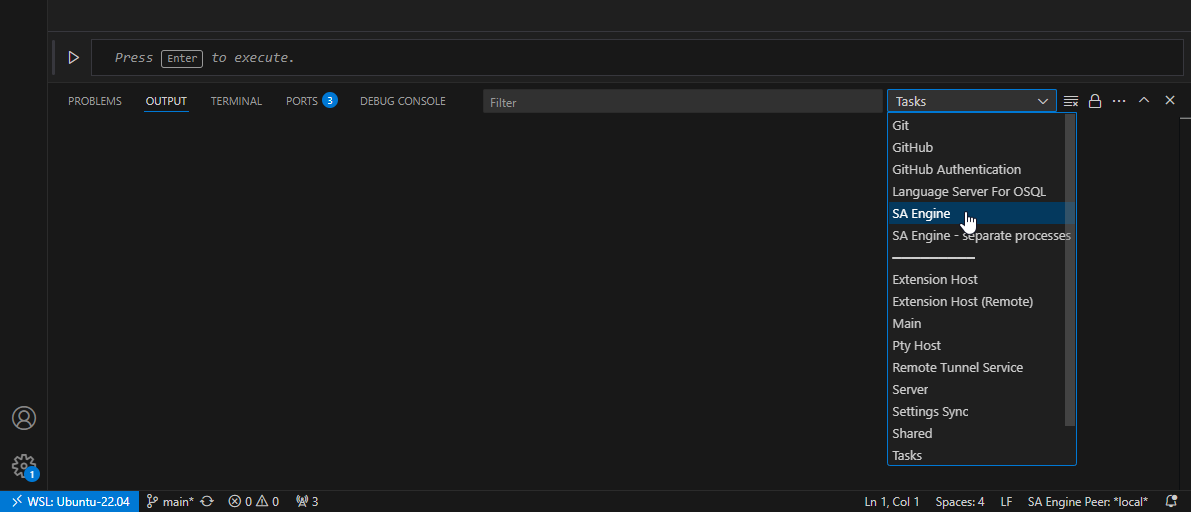
SA Engine in the output drop-down list.
When the console logger is activated, the output from all print() statements will show in the Output window.
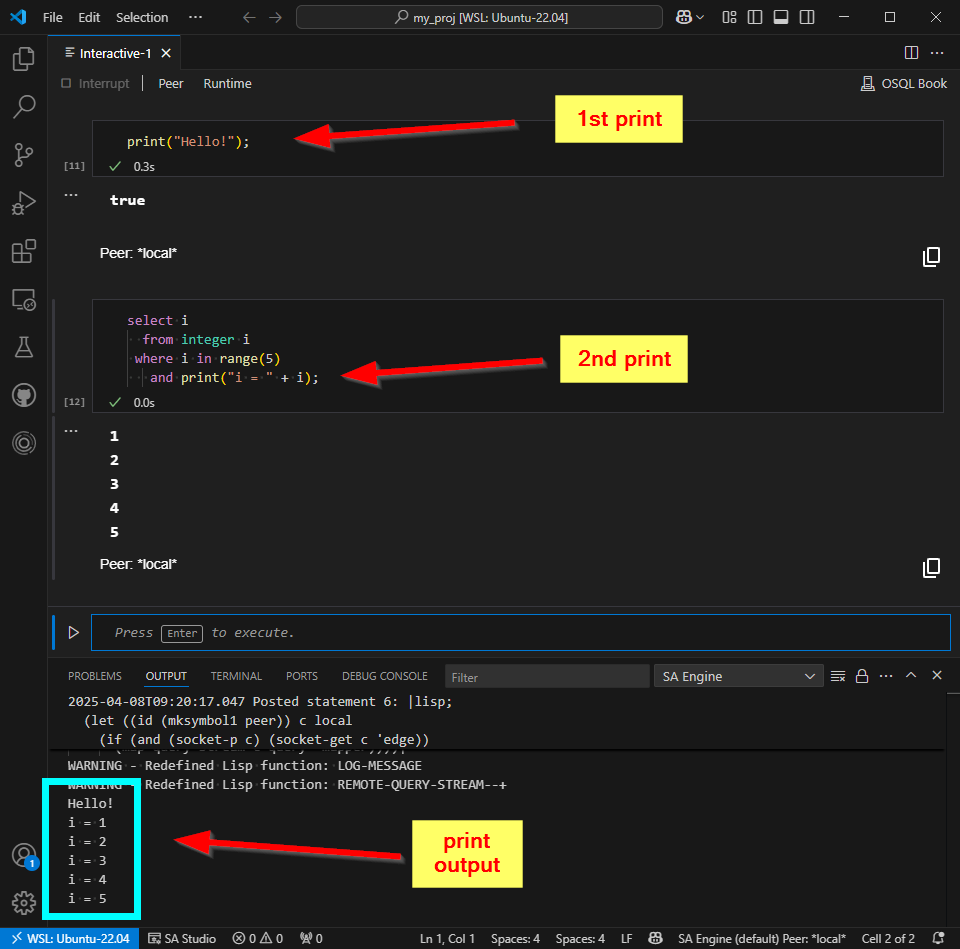
SA Engine print() output in the VSCode output window.
The console logger can be deactivated with console_logger(false) should you want to turn off the print output.
2. Work on an edge instance
A second, more convoluted, way of getting output from print() when working in VSCode is to use a separate edge instance and connect it to the interactive window. It is possible to "attach" the interactive window to an edge running in a console. For this you need to have a nameserver running locally and an edge instance to connect the interactive window to. Here are step-by-step instructions on how to set this up.
- Have VSCode running with an interactive window.
- Start a terminal in VSCode.
- In the terminal, start an SA Engine nameserver by running
sa.engine -ns. - In the interactive window, register your client in the nameserver by running
reregister("me"). - Start another terminal in VSCode.
- In the new terminal, start an SA Engine edge by running
sa.engine -ee1. - Now you can select the edge
E1as the default peer for the interactive window. - Now everything you run in the interactive window will be run on the edge
E1which has a console. So anyprint()output will be printed to the console in the terminal window for the edge.
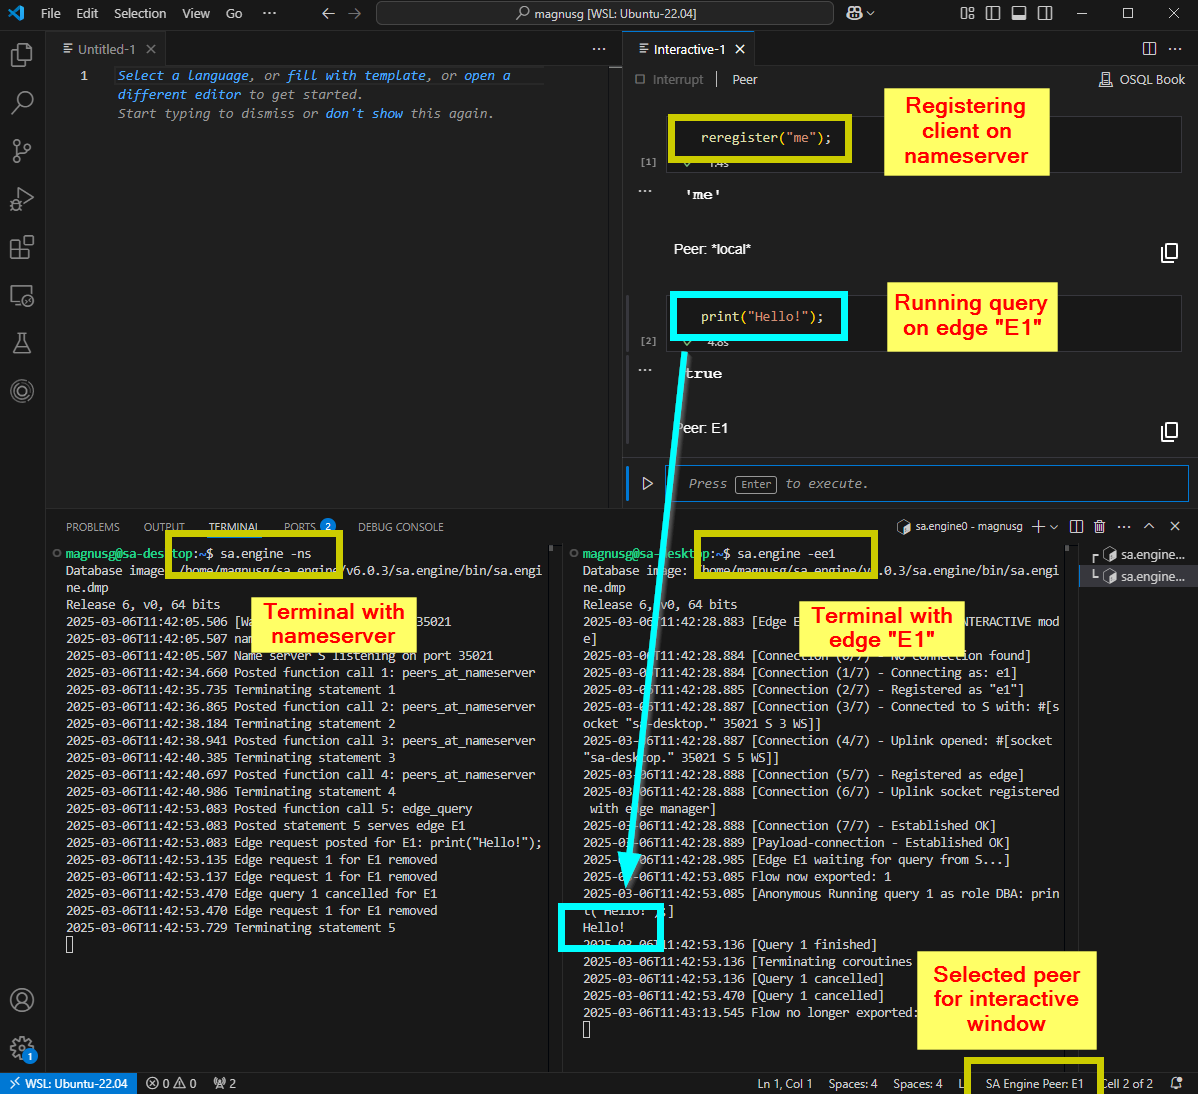
Get print() output from edge in terminal.
In this way we get the print output to a console inside VSCode. Attaching the interactive window to an edge instance can be convenient when working on edges to simulate a production environment. Note however that the output window for is a bit verbose for edge instances.
3. Subscribe to the output of a peer
If you have an edge instance connected to a nameserver, then you can use subscribe("OUTPUT@<edge>") to listen to the print() output from the edge. This will give you the output from the edge without any status messages, like [Query 1 finished] etc.
If we use the setup from the previous section (2), then we can start a new SA Engine client in a new terminal and use subscribe("OUTPUT@e1") to listen to the print() output from edge E1. Subscribing to OUTPUT on an edge starts a flow on that edge which captures all output from print(). In the image below we have started a new SA Engine client (bottom right) and set it to subscribe to the output from edge E1, and we can see that when we use the interactive window to print output on edge E1 the output is significantly more condensed in the new SA Engine window (bottom right) compared to edge E1's console window (bottom left).
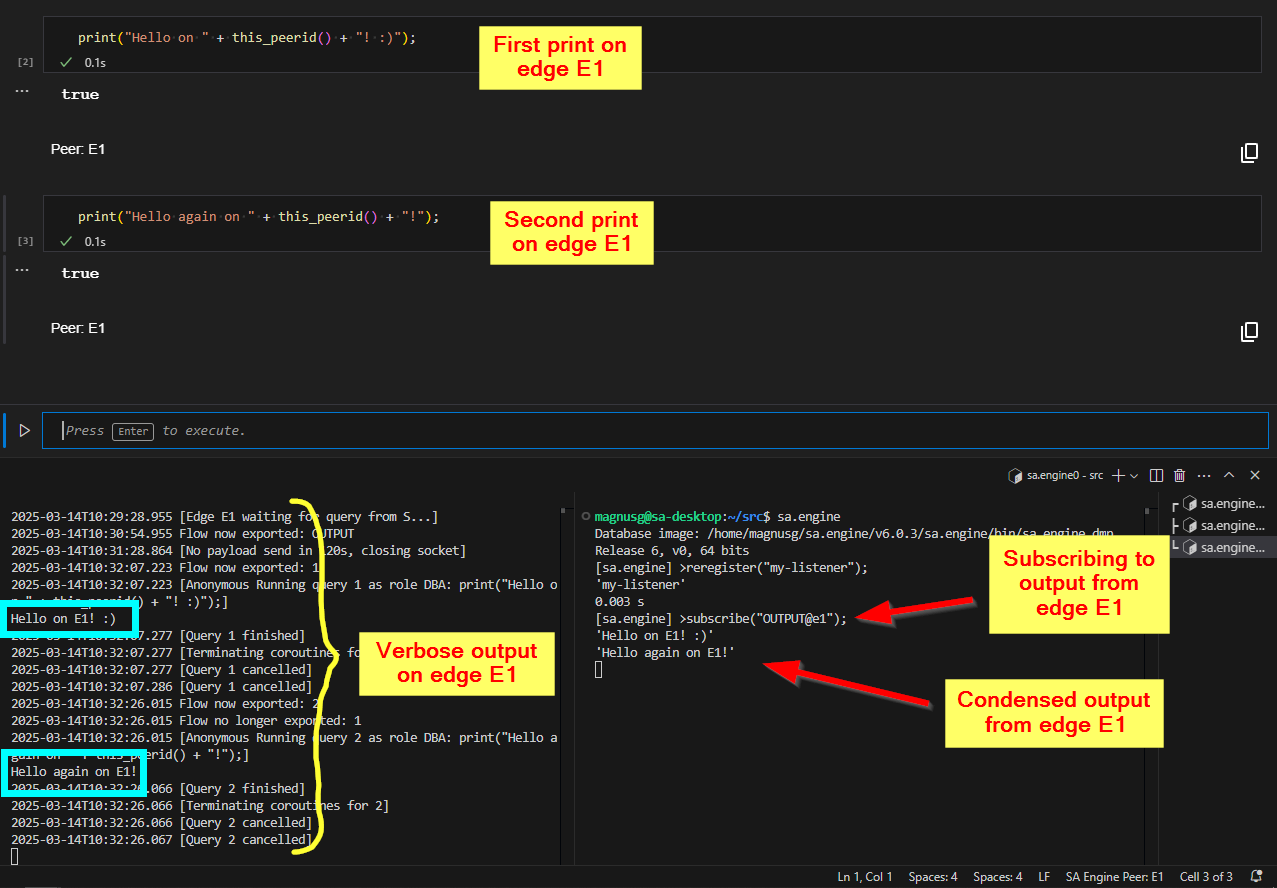
Additional SA Engine (bottom right) listening on output from edge E1 (bottom left).
A note on the SA_HOME folder for edge instances
Edges get a different SA_HOME folder than clients. If you start an edge and specify /home/user/SA as SA_HOME, then SA_HOME for the edge will be set to /home/user/SA/peers/<edge>. This means that if you have followed the recommended set up for VSCode and use a custom working directory (according to Set custom SA_HOME folder), it is a good practice to use the same SA_HOME path for edges as you specified in the .sa_startup.json configuration file.
For example, if you have a project folder ~/my_proj/ with a sub folder ~/my_proj/SA/ which you have set as your SA_HOME for the project by having a ~/my_proj/.sa_startup.json config file that says { "SA_HOME": "SA" }, then you should provide that folder as SA_HOME for the edge instance as well.
sa.engine -ee1 -f ~/my_proj/SA
Note however that the SA_HOME for the edge will then be set to the following sub folder.
~/my_proj/SA/peers/E1
If we start another edge e2 in the same way
sa.engine -ee2 -f ~/my_proj/SA
it will get its SA_HOME folder next to e1.
~/my_proj/SA/peers/E2
The resulting folder structure is shown in the image below.
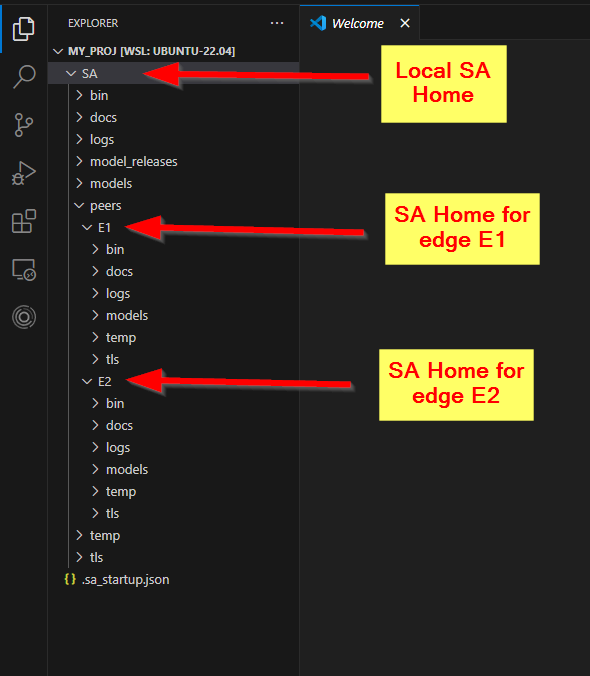
SA Home folder tree for local client and two edges.
So all models you develop on the edge will have to reside in ~/my_proj/SA/peers/E1/models, and not in ~/my_proj/SA/models since that will be the model folder for the client that was started when VSCode started, and not the edge instance that you started in the terminal.
Data flows for debugging
SA Engine works on streams of data. An analytics pipeline generally consists of consecutive operations on a stream of data. Sometimes it is desirable to fork streams into parallel pipelines. This is done with flows (which we briefly touched upon when talking about print()). With flows you can publish data on a separate "flow" which is a named data stream. Although the primary usage for this is to enable forking in processing pipelines, it is also a handy debugging tool when you want to examine intermediate results in a pipeline. You simply add a call to publish() or emit_on_flow() in your query and output the stream or data you want to examine on the flow (note however that emit_on_flow() comes with a large performance penalty compared to publish()). Then you start a listener to that flow with subscribe() and it will output the data you put on the flow.
For example, lets consider a temperature sensor example where we have a query that receives the temperature in Fahrenheit and converts it to Celsius. If we want to examine the stream of Fahrenheit values we can publish the values to a flow.
If the original query looks like the following,
select stream of temp
  from stream of real temp,
       stream of real fahrenheit
 where fahrenheit = sensor_stream()
   and temp = to_celsius(fahrenheit);
then we can insert a publish() to emit the Fahrenheit values on a flow.
select stream of temp
  from stream of real temp,
       stream of real fahrenheit,
       stream of real f
 where fahrenheit = sensor_stream()
   and f = publish(fahrenheit, "fs")           // publish fahrenheit stream on flow "fs"
   and temp = to_celsius(f);
Now we can start a listener that will output the Fahrenheit stream when the above query is running.
subscribe("fs");
The image below illustrates the data flow.
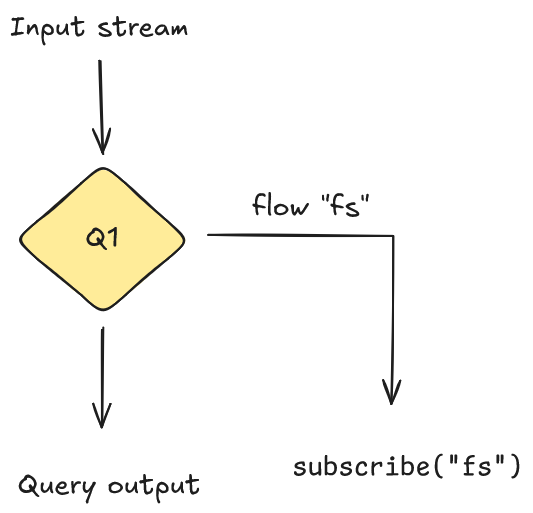
This is very useful for visualizing intermediate results and verifying that the internals of a query work as expected.
It is highly recommended to read more about flows in the documentation to get to learn more about how they work and how you can use them for debugging purposes.
Any flows used for debugging purposes should be removed before going to production. This is especially the case if using emit_on_flow() which comes with a large performance penalty compared to publish().
Error messages and type errors
Common error messages
Syntax error
Syntax error simply means that there is an error in the syntax and the query cannot be parsed. The underlying reason can be many different things since it includes everything that does not follow correct OSQL syntax.
However, there are a few situations worth mentioning. For example you might write what looks like a perfectly valid query like the following.
select c
  from real a,
       real b
       real c
 where a in range(3)
   and b = a*a
   and c = exp(b);
But it gives the following error.
Error:
syntax error in line 4
       real
          ^
While this might look like there is something wrong with the real on line 4, it is a missing comma , on line 3 that gives rise to the error. The parser expects either a comma , or a where keyword after real b, but when it finds a real instead it complains about the real. So adding a comma at the end of line 3 fixes the issue.
select c
  from real a,
       real b,
       real c
 where a in range(3)
   and b = a*a
   and c = exp(b);
Same behavior comes if you have an extra comma , on line 4. Then the parser expects another variable declaration but gets confused when it is a where keyword. Consider the following query.
select c
  from real a,
       real b,
       real c,
 where a in range(3)
   and b = a*a
   and c = exp(b);
Which results in the following error message.
Error:
syntax error in line 5
 where
     ^
But just as before it is not the where that is the problem, but the extra comma on the line before.
Unbound variable
This simply means that a query uses a variable that hasn't been declared. For example, the following query uses a variable y that is not declared.
select x
  from real x
 where y in range(3);
This gives rise to the following error message.
Error:
Unbound variable Y
Changing the y to an x, which is declared, solves this error.
select x
  from real x
 where y in range(3);
Declared variable not bound anywhere
This simply means that there is a variable declared in the query but the variable has not been bound to any result, thus making it obsolete. For example, in the following query we have a variable y that is declared as real, but it is not used anywhere in the query.
select x
  from real x,
       real y
 where x in range(3);
This results in the following error message.
Error:
Declared variable not bound anywhere y
Illegal function result
Consider the following query.
select y
  from real x,
       real y
 where y in range(5)
   and y*5.0;
Which gives the following error.
Error:
Illegal function result times(Real,Real)
Function times defined for signatures:
...
A common mistake is to think it is the input parameter types (Real and Real) that are wrong, but if we read the error message closely we see that the culprit here is the result type. The and in the query expects a predicate which returns a boolean, but y*5.0 returns a Real.
Now that we know that it is the return value that is the problem it is easy to see that we have forgotten to assign x to the result of y*5.0. So inserting x = will solve the problem.
select y
  from real x,
       real y
 where y in range(5)
   and x = y*5.0;
Too few arguments in predicate
This is another error message similar to “illegal function result“, but is more common when working with stream variables. Consider the following query.
select s
  from stream of real s
 where s = simstream(0.5)
   and s * 0.5;
Which gives the following error.
Error:
Too few arguments in predicate (#[OID TRANSIENT 2298156] S 0.5)
(Note: the OID number can vary between runs)
Just as in the example for “illegal function result“, this message can also make the user focus on the input arguments to the multiplication on line 4 (i.e., s and 0.5). But it is again a mismatch in result type vs what is expected by and. Assigning the result of s * 0.5 to a declared stream variable solves the problem.
select t
  from stream of real s,
       stream of real t
 where s = simstream(0.5)
   and t = s * 0.5;
Another, more subtle variant of the same error is for functions where the return type is unclear. Consider for example the following predicate in a query.
...
and publish(my_stream, "fs");
This also gives the following error.
Error:
Too few arguments in predicate (#[OID 1668 "STREAM.CHARSTRING.PUBLISH->STREAM"] MY_STREAM fs)
So even though publish() might look in the query like it is returning a boolean, the error message indicate that there is a mismatch in the return type of publish() and what is expected by and. In the error message we see the signature of publish() and that it returns a STREAM. So to solve the issue we need to declare a stream variable and assign it to the returned value from publish().
Determine types
Sometimes when working with nested objects it can be difficult to know the type of objects in the nested structure. For example, a function with signature …() → timeval does not say anything about what type of values are stored in the timeval. It could be a timeval of real, timeval of array, or a timeval containing any other type. The same goes with …() → vector since a vector can contain any type of object.
For example, consider the scenario where we have a function that returns a stream of timeval. It could be a timestamped sensor stream on some edge device where we are unsure of the contents of the stream (in the example we will create the stream ourselves so we will know the data types, but we will pretend that we don't).
create function some_stream() -> stream of timeval
  as select vstream([ts(now(), [1.23, "hello", array("F32",[1,2,3])]),
                     ts(now(), [1.44, "goodbye", array("F32",[4,5,6])])]);
Let’s say we have a function that want to do some calculations on the sensor stream. We try to write the function but we realize that we don't know the type of the value in the timeval.
create function my_func() -> stream of real
  as select stream of ...
       from timeval tv,
            ??? val
      where tv in some_stream()
        and val = value(tv);
To be able to finish writing this function we will have to determine what type of objects the timeval contains. There are some functions that we can use to help us with this.
If we only have the name of the function we can use signature() to get the complete signature.
signature("some_stream");                // or signature(#'some_stream')

// Output:
'some_stream()->Stream of Timeval'
This does not help us in this case since we already know the function returns a timeval. But this can be useful in situations where you only know the function name.
There is also a function typeof() which returns the static type of an object. This is the type that the compiler sees at compile time, before the object has been created. This is usually the same as what is stated in the code, unless there has been some type deduction before the code reaches the compiler.
typeof(some_stream());       // static type (what the compiler sees)

// Output:
#[OID 1292 "STREAM-TIMEVAL-VECTOR"]
Here we see that the static type of the function is stream of timeval of vector. So in this case the type deduction has determined that the timeval contains a vector, which is new information for us. But the static type does not tell us what the types are for the objects inside the vector. For this we need to create the objects and look at what types they actually get.
To determine what type an object has we can use the typesig() function (short for “type signature”). What typesig() does is look at the type signature of the object after it has been created. This will contain the full type information since an object must have a type in order to be instantiated.
typesig(some_stream());

// Output:
'Stream of Timeval of Vector'
Here we see that the object created by some_stream() is a stream object of timeval of vector. This we know already from the static type analysis we did.
In order to get more information we need to materialize the stream, which we can do with extract(). If we materialize the stream we will potentially get a large amount of values, but we only need the first value so we use first() on the stream to only get the first timeval. To extract the vector from the timeval we use the value() function. Since we want to know more about the objects in the vector we should first determine the size of the vector, which we do with the dim() function. Putting all this together we get the following query.
dim(value(first(extract(some_stream()))));

// Output:
3
We see that the vector in the timeval stream has three objects.
Now we can use typesig() to determine the type of each of the objects by indexing the vector.
typesig(value(first(extract(some_stream())))[1]);
typesig(value(first(extract(some_stream())))[2]);
typesig(value(first(extract(some_stream())))[3]);

// Output:
'Real'
'Charstring'
'Array of F32'
So now we have determined the object types for the contents of the streamed vectors, and we see that the types match the values we used in the declaration of the some_stream() function.
Best practices
When working with declarative languages in general, and OSQL specifically, there are some best practices that can help you minimize the amount of bugs and to iron out any bugs that manage to slip in.
- Use iterative development -- test each step along the way
- Use synthetic data
- Split up complex queries into smaller functions that can be tested individually
- Use transactions to undo work
- Get comfortable with the command line tools
Iterative development and testing
The best way of building a big model or program is to start by implementing small building blocks and putting them together into larger chunks of code once they have been properly tested.
For example, let's say we want to implement a model that converts a stream of temperature readings from Fahrenheit to Celsius and then send the stream only if the temperature is higher than 50 degrees. Instead of writing all the logic in a single query in one go (which would be possible but a bit cumbersome) we develop the model iteratively. First we write the conversion from Fahrenheit to Celsius and make sure that we get that working correctly before we continue with the other logic.
create function to_celsius(real fahrenheit) -> real
  as (fahrenheit - 32) * 5 / 9;
When we are sure that the temp conversion function is correct, then we can implement the threshold logic.
create function is_above_limit(real temp) -> boolean
  as temp > 50;
When we have made sure that the threshold implementation works correctly then we can combine the two into a full model.
create function my_temp_stream() -> stream of real
  as select stream of temp
       from real temp, real fahrenheit
      where fahrenheit in sensor_stream()
        and temp = to_celsius(fahrenheit)
        and is_above_limit(temp);
As in all software development, writing tests is crucial for building confidence about software functionality. OSQL has a built-in test framework where query result can be verified with the validate “test-name“ check <call> => <expected-result> statement. It is highly encouraged to use these test statements extensively when writing OSQL code for SA Engine. In OSQL Testing you can read more about how to test OSQL code, and in Model testing and integration you can read about how to do testing on models.
In the example above we would write tests that verify the functionality of to_celcius() and is_above_limit() before we combine them into the full model. The tests could look something like the following.
validate "to_celsius"
  check roundto(to_celsius(88),2) => 31.11
  check roundto(to_celsius(0),2) => -17.78;

validate "is_above_limit"
  check is_above_limit(52) => true
  check is_above_limit(13) => null;
We would also write tests for the full model, but to verify its functionality we would have to generate a synthetic data stream that mimics the data coming from the sensor. How to generate synthetic data is described below.
Use data generators
When testing and debugging it is useful to have an easy way of creating synthetic data streams. With synthetic data streams you can mimic real-world data streams and have full control over the values. This means that you can create anomalies, edge cases, and error states as input to help you understand the behavior of your code that consumes the data, and to create useful unit and integration tests.
A simple way of creating synthetic data streams is with vstream() which takes a vector and turns it into a stream of the vector elements.
set :s = vstream([1,2,3,4,5,6]);

select i+10
  from integer i
 where i in :s;

// Ouput:
11
12
13
14
15
16
The contents of the vector is not limited to basic data types.
set :s = vstream([ts(now(), array("F64",[1.0,2.0,3.0])),
                  ts(now(), array("F64",[4.0,5.0,6.0])),
                  ts(now(), array("F64",[7.0,8.0,9.0])),
                  ts(now(), array("F64",[10.0,11.0,12.0]))]);

select a[2]
  from array a, timeval tv
 where tv in :s
   and a = value(tv);

// Output:
2
5
8
11
However, using variables as streams does not work inside functions. For example, the following code produces an error.
create function consume_stream() -> stream of real
  as select a[2]
       from array a, timeval tv
      where tv in :s
        and a = value(tv);

// Output:
Error:
Unbound variable :S
If you want to use data streams in functions you will have to either pass the stream as an input parameter or make a data generator function.
Example passing stream as input parameter:
create function consume_stream(stream of timeval s) -> stream of real
  as select a[2]
       from array a, timeval tv
      where tv in s
        and a = value(tv);

consume_stream(:s);

// Output:
2
5
8
11
Example using a data generator function:
create function data_generator() -> stream of timeval
  as vstream([ts(now(), array("F64",[1.0,2.0,3.0])),
              ts(now(), array("F64",[4.0,5.0,6.0])),
              ts(now(), array("F64",[7.0,8.0,9.0])),
              ts(now(), array("F64",[10.0,11.0,12.0]))]);

create function consume_stream() -> stream of real
  as select a[2]
       from array a, timeval tv
      where tv in data_generator()
        and a = value(tv);

consume_stream();

// Output:
2
5
8
11
Undo work
The system logs your changes through Transactions. You can undo your work with the rollback command. And the commit command will create a new save point. Any rollback call will revert the state back to the latest commit (or to the initial state if no commit has been done).
The transactions stored through commit will be persisted in the database image file. So if you have made some changes -- like creating some functions or tables -- and then use commit to persist those changes, then the changes will be present whenever you start a new instance of SA Engine with the same database image file. If no image file is specified when starting SA Engine, it will use the default image file $SA_ENGINE_HOME/bin/sa.engine.dmp. We refer to the SA Engine CLI documentation for how to start SA Engine with custom database image files.
Administration for troubleshooting
Log files
SA Engine does not produce any log files out-of-the-box. When running SA Engine in a terminal, all output is going straight to the console window. But running SA Engine locally in the console, or in VSCode, is basically only done in early stages of the development phase. In later stages it is common to deploy SA Engine on edge devices where it can run without a shell or terminal attached to the SA Engine process. In these instances it is a good habit to redirect all output to a log file so there is a record of the output if something goes wrong.
The following command is an example of how SA Engine can be run on a Linux edge device with output redirected to a log file.
nohup sa.engine/bin/sa.engine -f SA \
        -o'connect.osql' >> /tmp/sa.engine.log 2>&1 &
This starts SA Engine as a process that is not connected to the shell (the process will not die when the shell is closed). It specifies SA/ as its SA_HOME folder, it runs the OSQL script connect.osql on start (likely connecting to a server as an edge device), it concatenates all output from the process to the text file /tmp/sa.engine.log, and it redirects all error output to where the standard output is written so any potential error will also be written to the log file.
If the disk space available on the device is limited, or if SA Engine is expected to run for a long period time, it is recommended to set up rotating logs to prevent the risk of filling up all the available available disk space. How this is done differs between operating systems, but in Linux for example, you can use the logrotate utility.
Restart SA Engine
SA Engine cannot be restarted from within SA Engine. You can shut down an SA Engine instance with the quit command. This will finish the SA Engine process. However, to restart the process you will have to set up some administrative service that restarts the process whenever it goes down or if the device reboots. This is useful when running SA Engine on edge devices and you want the SA Engine instance to be accessible from remote after a reboot. How this is done varies between operating systems, and many operating systems provide multiple ways of achieving this.
In Run an edge as a service you can learn how to set up SA Engine as service using systemd on a Linux device.